
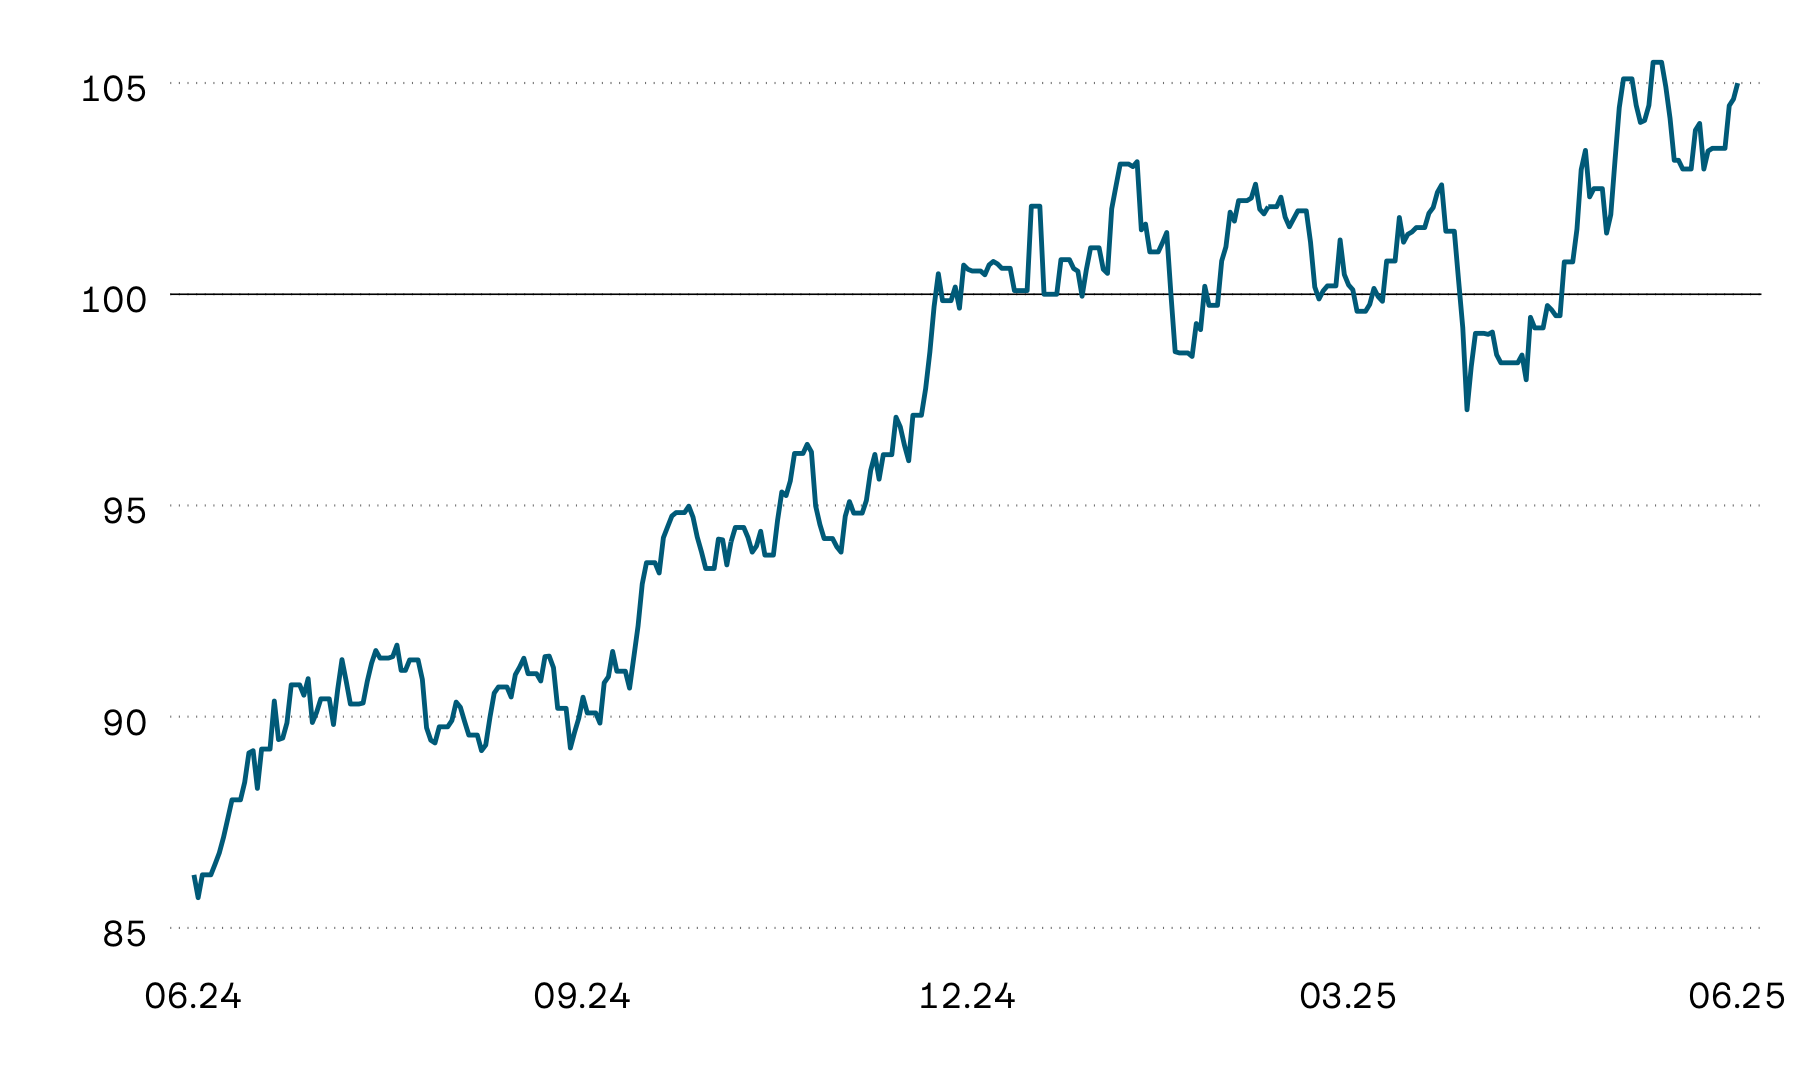
The bond markets remained largely calm last month and trended sideways. The USA did experience some temporary nervousness in response to the debate surrounding Trump’s tax reform, but this quickly subsided.
Market overview: Markets defy trade dispute
The financial markets were relatively calm last month. Equities again made substantial gains, particularly in the USA. The US trade dispute seems to have faded from the spotlight, at least for the time being. However, it is likely to come into renewed focus as the deferral period for import tariffs ends next month.
Indexed performance of government bonds in local currency
100 = 01.01.2025
Most of the world’s bond markets trended sideways. In the USA, interest rates rose for a time in the second half of May after the House of Representatives passed Trump’s “big beautiful bill”. This draft tax legislation would enable an extension of existing tax benefits and additional relief, but with no major savings. This fuelled concerns about long-term fiscal stability and weighed on US bond markets, although the situation quickly settled down again. In Europe and Switzerland, by contrast, the situation remained largely calm. Neither the renewed key interest rate cuts by the European Central Bank (ECB) and the Swiss National Bank (SNB) nor the recent decline in inflation rates in Europe and Switzerland changed this.
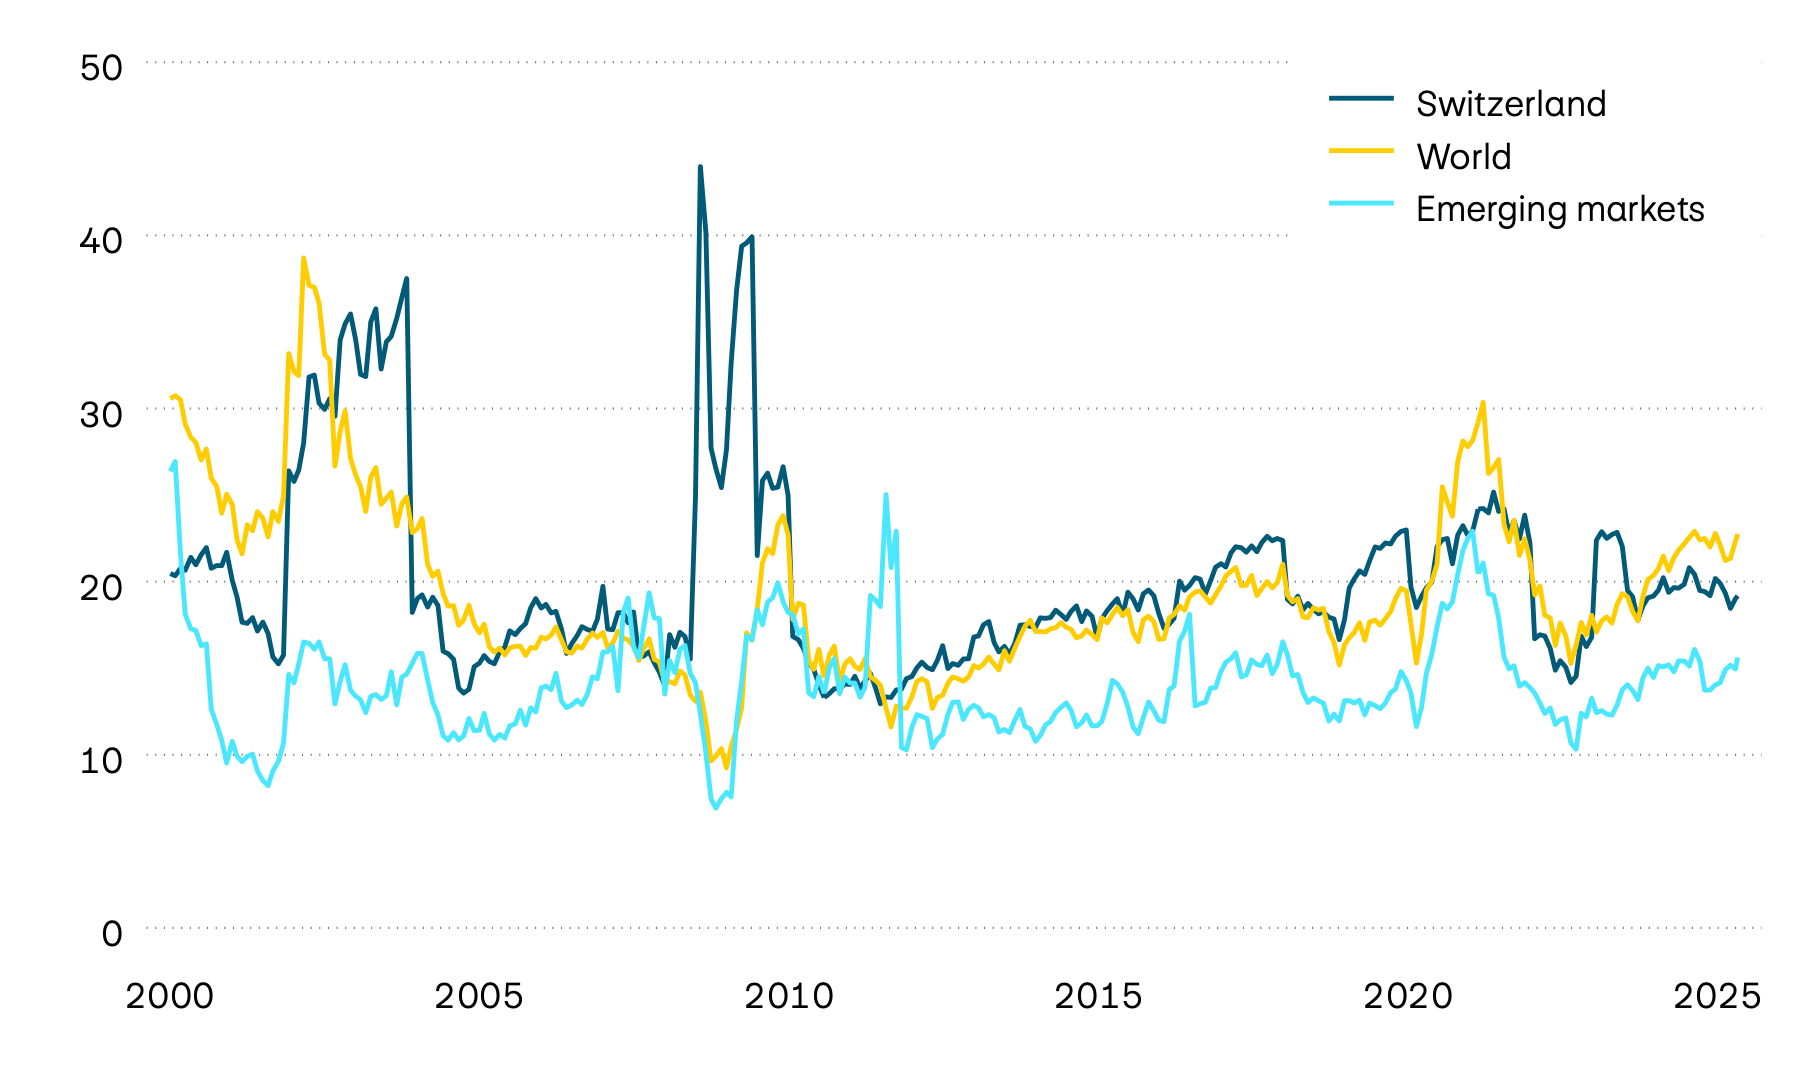
Trend in 10-year yields to maturity
In percent
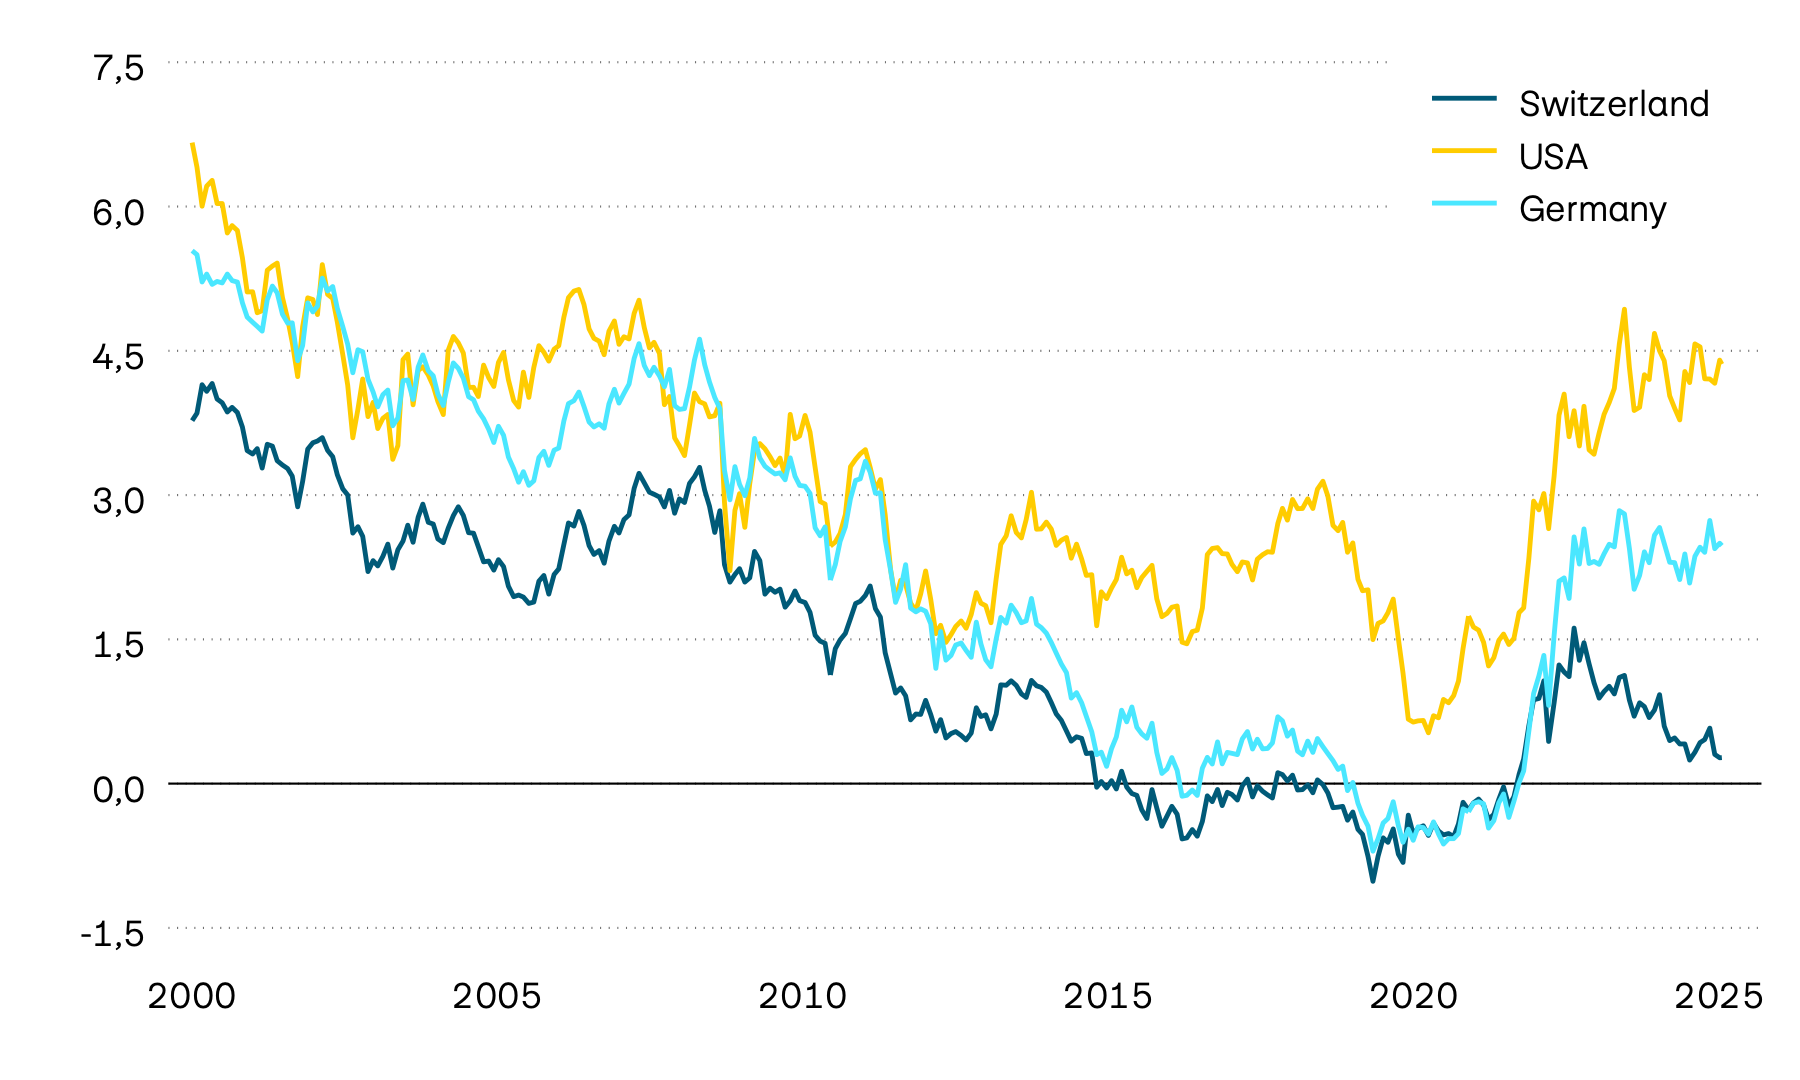
Yields to maturity on 10-year government bonds generally trended sideways last month in both the United States and Europe. In the USA, yields continue to fluctuate around the 4.4 percent mark. At the beginning of the year, they were still close to 4.8 percent at times. The trend in Switzerland continues to stand out. Yields to maturity on 10-year government bonds remain close to zero. Yields to maturity on short-term Swiss government bonds are already in negative territory.
Credit spreads on corporate bonds
In percentage points
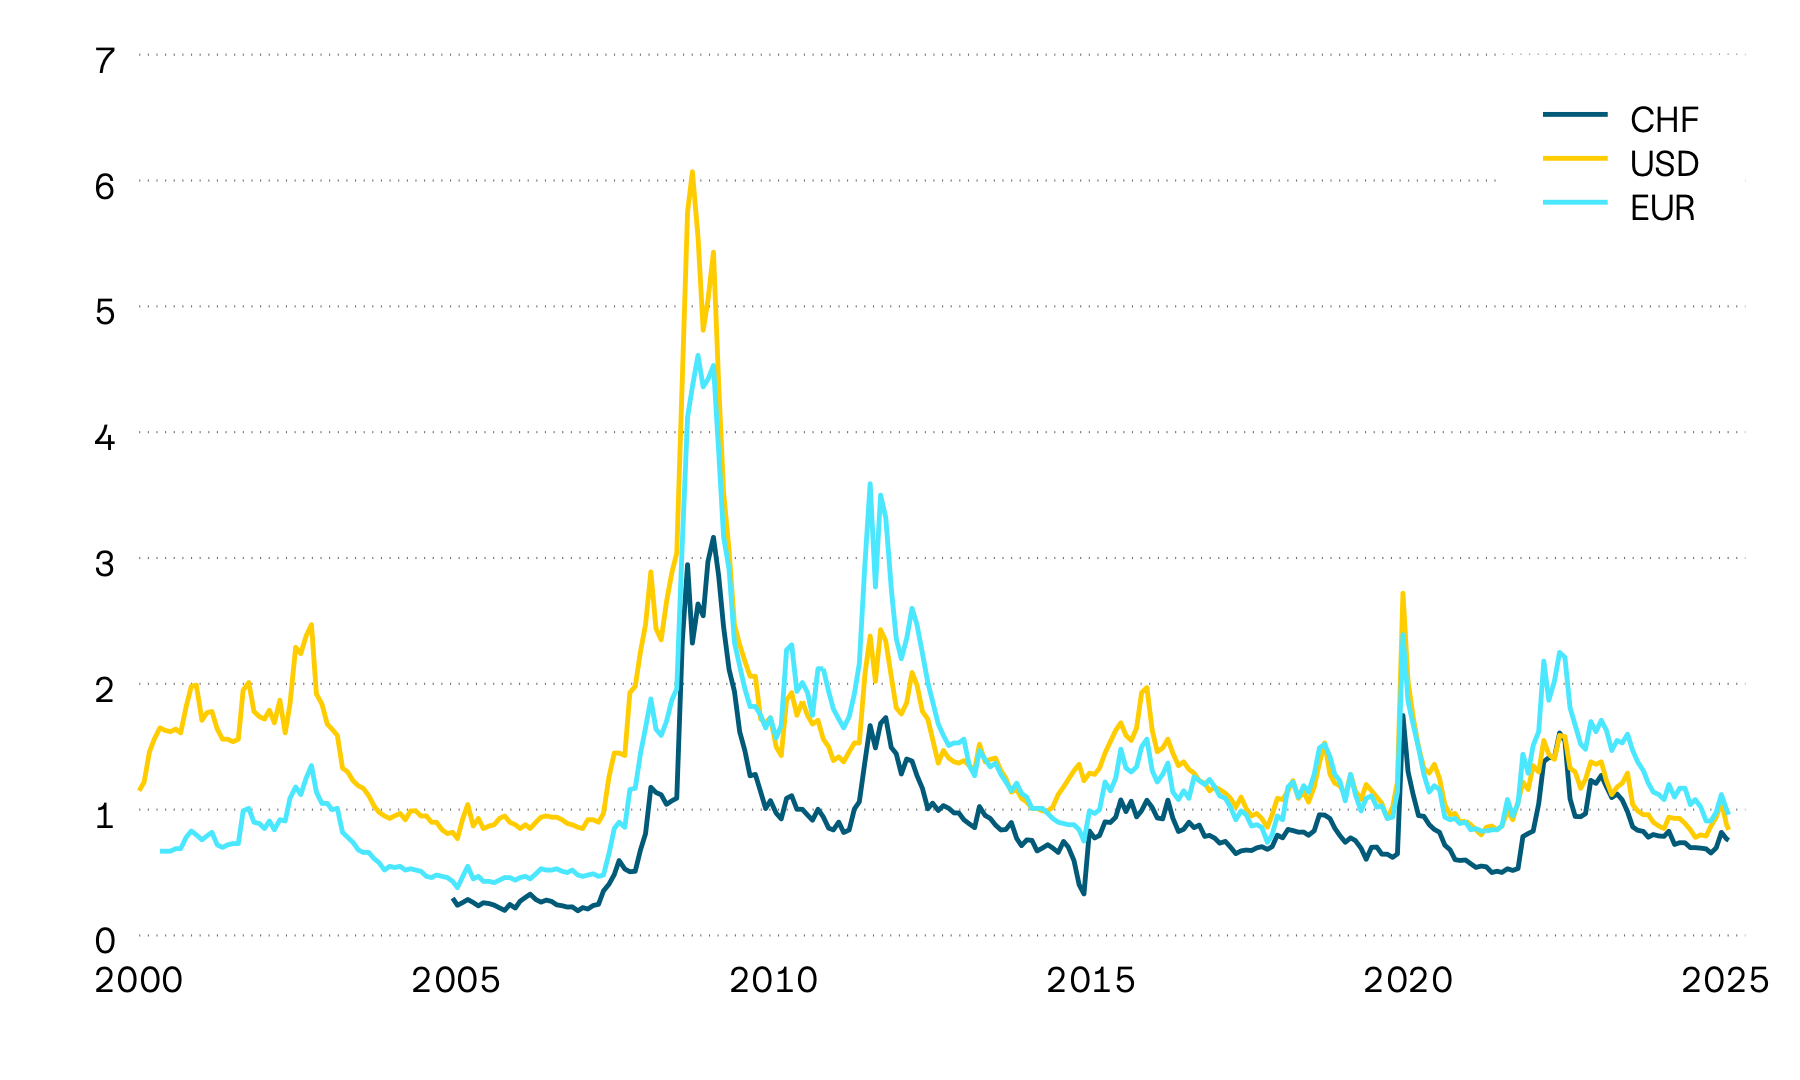
Credit spreads on corporate bonds widened over the course of the US trade dispute, but there has been a significant decline recently. The decline was most pronounced for corporate bonds with a lower credit standing. This suggests that fears of recession are fading to a large extent.
Equity markets made further gains last month, with the US market in particular standing out. However, this was only of limited benefit to foreign investors as the US dollar’s weakness significantly reduced these price gains.
Indexed stock market performance in Swiss francs
100 = 01.01.2025
Stock markets performed encouragingly last month. The US market was particularly strong, gaining just under 4 percent. The main drivers were tech stocks. It means annual US stock market returns are now back in positive territory, but only in local currency. The dollar’s weakness since the beginning of the year, which has resulted in a loss of more than 10 percent in value, continues to weigh heavily on the portfolios of investors in Swiss francs. The European stock markets remain the absolute front runners. They lead the way worldwide, with an annual return of well over 10 percent, including in Swiss francs. The Swiss stock market is also performing well, with annual returns of just under 10 percent. Growing uncertainty surrounding the US government appears to have boosted demand for European securities.
Momentum of individual markets
In percent
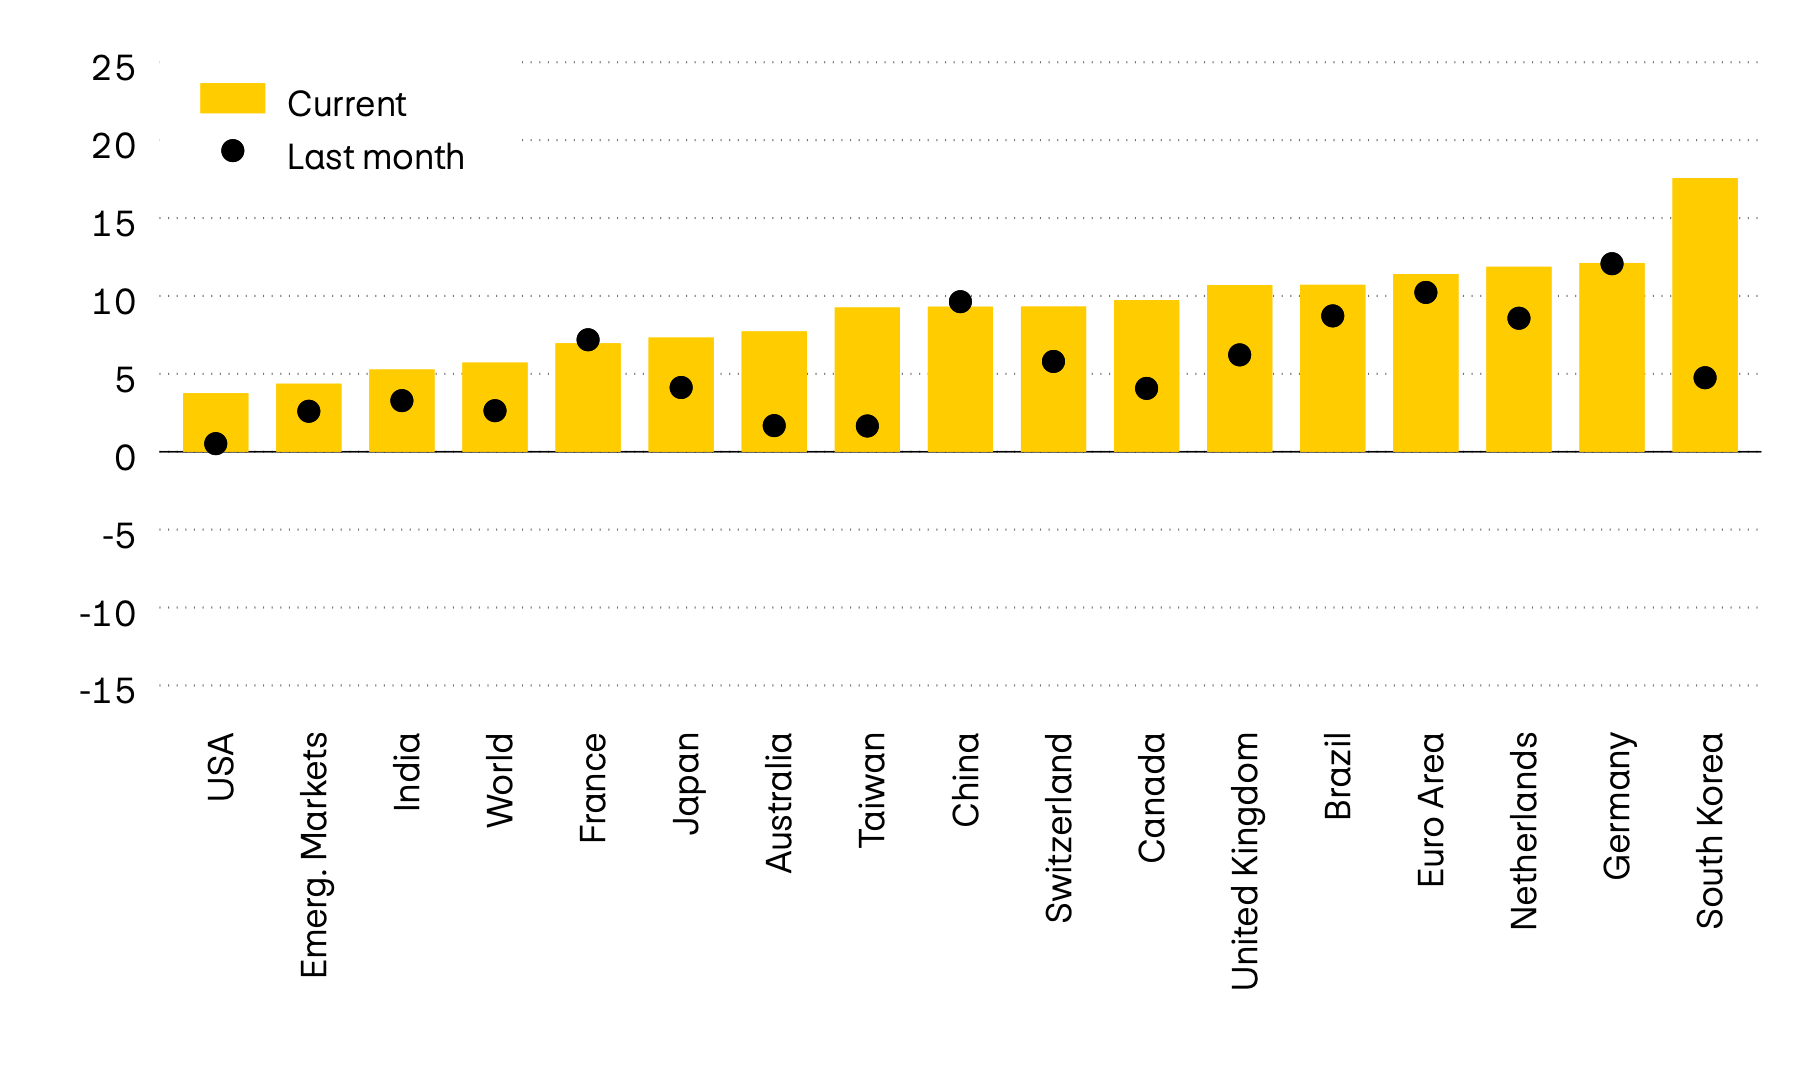
The positive global sentiment on the stock markets boosted upward momentum again last month. Momentum on the US stock market, previously negative, has now returned to positive territory. The Korean stock markets have displayed particular dynamism recently. The market has recovered strongly since the presidential election, Previously, the upturn was likely to have been slowed by the political uncertainties surrounding the former president. The continued strength of the German stock market also remains striking.
Price/earnings ratio
The price/earnings ratio (P/E ratio) rose further last month. This is likely due first and foremost to the ongoing stock market recovery. Corporate earnings remain stable so far, although some companies have lowered their expectations for the second half of the year somewhat in light of the US trade dispute.
Exchange-listed Swiss real estate funds continued to perform well this month, and are now also yielding clearly positive returns on an annual basis.
Indexed performance of Swiss real estate funds
100 = 01.01.2025
Swiss real estate funds made further gains this month, finishing the month close to their highest level. With a monthly return of over 3 percent, the annual return is now 5 percent. The continued low capital market interest rate in Switzerland, currently standing at just under 30 basis points, is likely to have helped to maintain robust demand for real estate funds.
Premium on Swiss real estate funds and 10-year yields to maturity
In percent
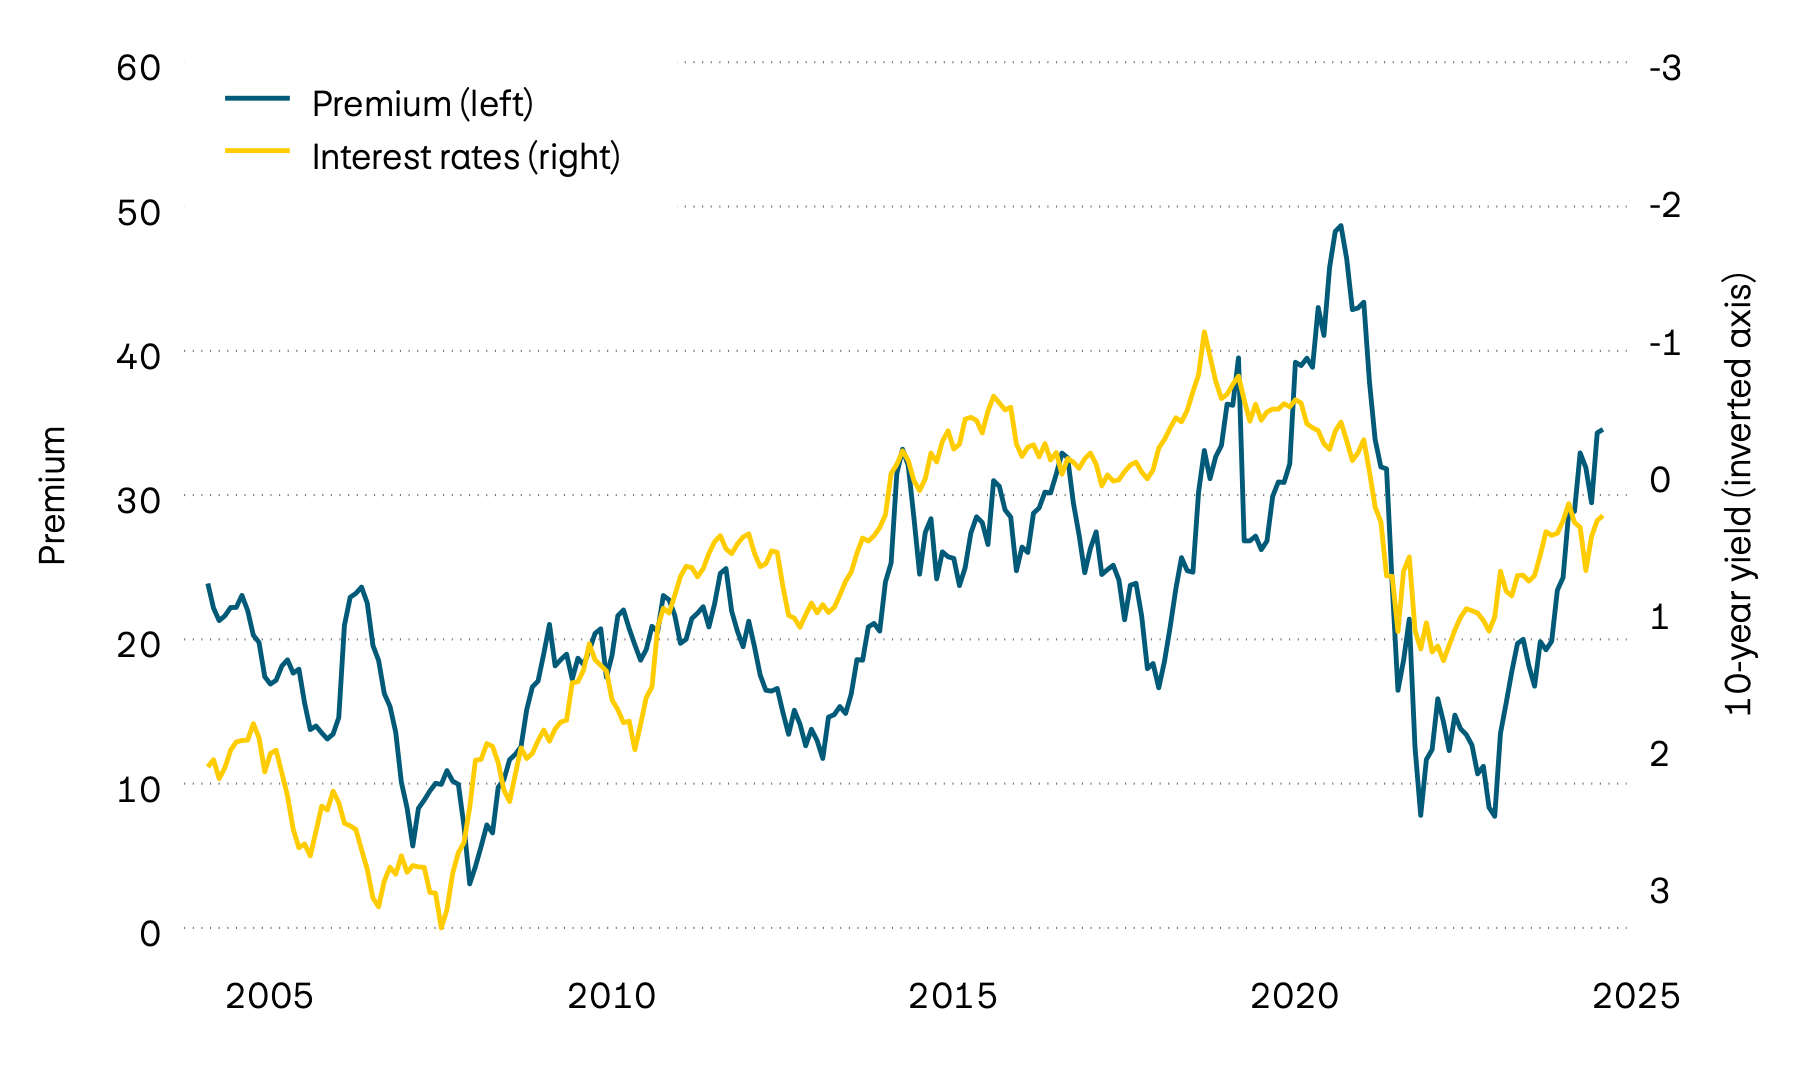
The positive price performance of exchange-listed Swiss real estate funds contributed to another increase in the premium paid by investors versus the net asset value of properties. Premiums are now at their highest level since the beginning of the year and remain well above the long-term average.
Three-month SARON and 10-year yields to maturity
In percent
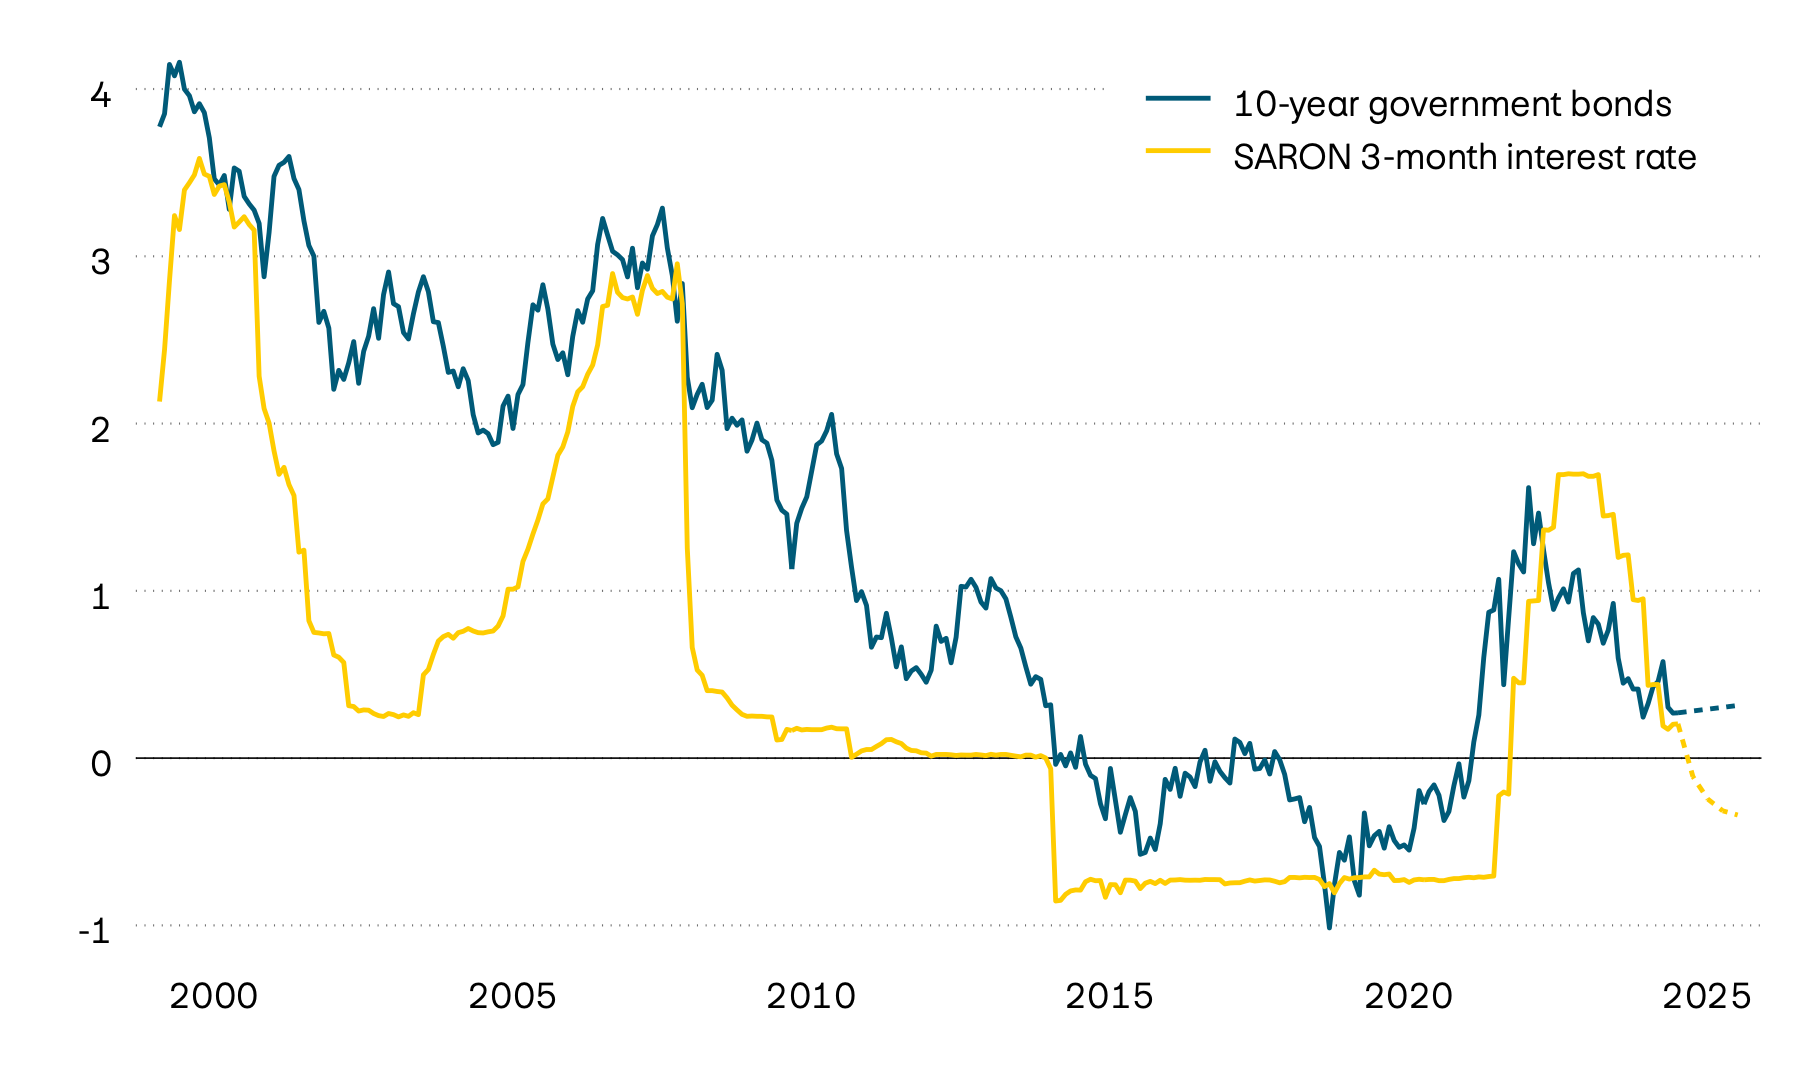
Yields to maturity on 10-year Swiss government bonds currently stand at only around 30 basis points. This means they remain at their lowest level since the beginning of the year and are only slightly above the 3-month SARON. In view of the recent return to negative inflation rates, the Swiss National Bank (SNB) lowered interest rates again at its last assessment in June, in line with market expectations. The SNB's key interest rate cut will cause the Saron to fall further.
Currencies
The US dollar remains weak this month as in the course of the year to date. The Swiss franc again made significant gains against the US dollar, but remained largely stable against the euro.
| Currency pair | Price | PPP | Neutral range | Valuation |
|---|---|---|---|---|
| Currency pair EUR/CHF |
Price 0.96 |
PPP 0.93 |
Neutral range 0.86 – 1.00 |
Valuation Euro neutral |
| Currency pair USD/CHF |
Price 0.81 |
PPP 0.80 |
Neutral range 0.70 – 0.90 |
Valuation USD neutral |
| Currency pair GBP/CHF |
Price 1.10 |
PPP 1.20 |
Neutral range 1.04 – 1.36 |
Valuation Pound sterling neutral |
| Currency pair JPY/CHF |
Price 0.56 |
PPP 0.86 |
Neutral range 0.70 – 1.02 |
Valuation Yen undervalued |
| Currency pair SEK/CHF |
Price 8.58 |
PPP 9.56 |
Neutral range 8.56 – 10.57 |
Valuation Krona undervalued |
| Currency pair NOK/CHF |
Price 8.15 |
PPP 10.55 |
Neutral range 9.30 – 11.80 |
Valuation Krone undervalued |
| Currency pair EUR/USD |
Price 1.16 |
PPP 1.16 |
Neutral range 1.01 – 1.31 |
Valuation Euro neutral |
| Currency pair USD/JPY |
Price 143.50 |
PPP 92.41 |
Neutral range 70.82 – 114.00 |
Valuation Yen undervalued |
| Currency pair USD/CNY |
Price 7.18 |
PPP 6.27 |
Neutral range 5.79 – 6.76 |
Valuation Renminbi undervalued |
Source: Allfunds Tech Solutions
The US dollar’s weakness once again dominated developments on the currency markets this month. The Swiss franc gained more than 3 percent against the US dollar this month, appreciating by more than 10 percent over the year as a whole. The Swiss franc remained stable against the euro. The euro is also virtually unchanged against the Swiss franc over the year as a whole.
Cryptocurrencies
| Cryptocurrency | Price | YTD in USD | Annual high | Annual low |
|---|---|---|---|---|
| Cryptocurrency BITCOIN |
Price 105,731 |
YTD in USD 13.23% |
Annual high 111,743 |
Annual low 76,244 |
| Cryptocurrency ETHEREUM |
Price 2,654 |
YTD in USD –20.35% |
Annual high 3,685 |
Annual low 1,471 |
Source: Allfunds Tech Solutions, Coin Metrics Inc
Gold
The gold price, measured in Swiss francs, trended sideways last month, but remains close to its record high.
Indexed performance of gold in Swiss francs
100 = 01.01.2025
The precious metal was unable to keep pace with the gains on the stock markets and, measured in Swiss francs, trended sideways this month. With an annual return of over 15 percent in Swiss francs, gold nevertheless continues to outperform most stock markets.